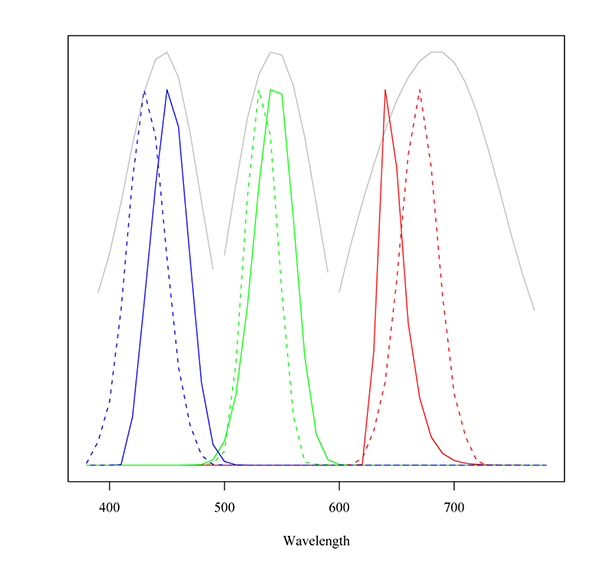
Figure B.1. Status M and Printing Density.

The figure shows the spectral response of ISO Status M (solid lines) and of SMPTE Printing Density (dashed lines). For comparison the spectral densities of the dyes in a camera negative are displayed as gray lines.