Figure 6.1. Gamut comparison of DLP, CRT, and print film in a chromaticity diagram.
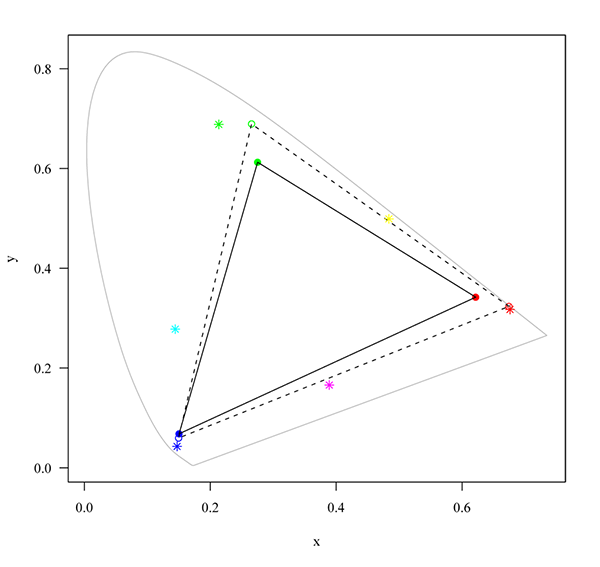
The horseshoe shaped outline represents the spectral colors. The closed circles and the triangle drawn in solid lines represent the color gamut of a CRT monitor. The open circles and the triangle drawn in dashed lines represent the gamut of a DLP projector. The asterisks mark the locations of the red, yellow, green, cyan, blue, and magenta color of a typical motion picture print film projected with a Xenon lamp.