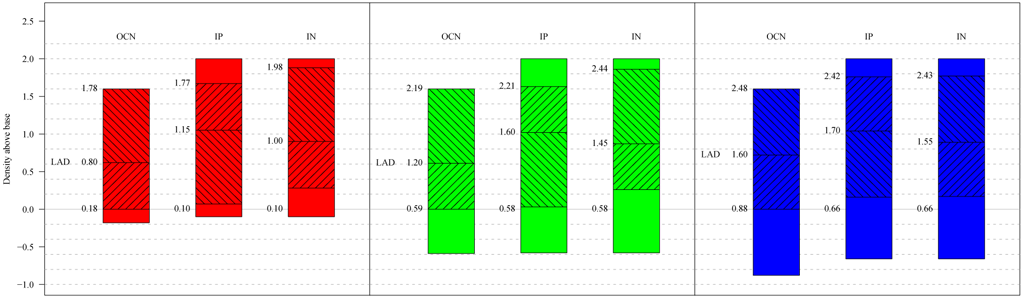
Figure 2.5. The IP/IN process
The numbers on the vertical axis in the graph are relative densities above base. The numbers beside the bars are absolute density values. In red for example, the OCN LAD value of 0.8 is printed to an IP LAD value of 1.15. This leaves enough room to accommodate the density range above and below the LAD (hatched in different angles) in the IP. The IP LAD is finally copied to an IN LAD of 1.00. The density range in the IN is the same as in the OCN, though the densities above base are shifted by 0.2 log D.