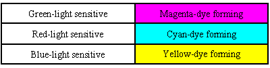
Figure 2.1. Cross section of color negative film before and after processing.
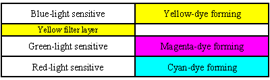
The yellow filter layer prevents any blue light from reaching the green-light-sensitive and the red-light-sensitive layer, which are sensitive to blue light as well. It is removed during the developing process of the negative.
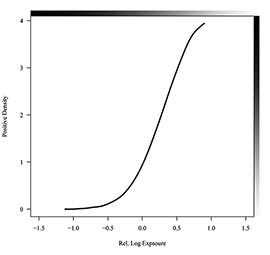
Figure 2.2. Characteristic curve of a color negative.
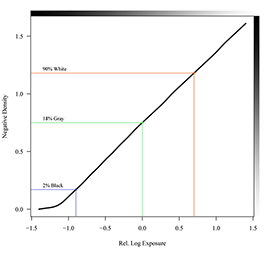
The figure shows how a negative records the relative scene luminance as film densities. Marked are the locations of the 2% black, 18% gray, and 90% white point. The scene luminance is expressed as log exposure, where 0.3 units equal one stop. Only the density of the green layer is shown and it is measured above base meaning the density of the unexposed film is subtracted.
The slope of the straight part of the curve, known as “gamma”, is around 0.6. Therefore, an exposure increment of 0.3 log E increases the density by 0.3 * 0.6 = 0.18 log D.
Negative film is still the most widely used acquisition medium for feature film productions. One of the reasons for this is that negative film can capture a wide contrast range in a scene.
Figure 2.1 shows a cross section of a color negative film. The first layer is sensitive to blue light. A yellow filter layer prevents any blue light reaching the green-light-sensitive and the red-light-sensitive layer, which are sensitive to blue light as well. When developing the exposed film, yellow, magenta, and cyan dyes are formed in the three layers. Photographic negative film produces its maximum amount of image dye from a maximum exposure and its minimum amount of dye from a minimum exposure. The result is an image where the tonal range and the colors are inverted.
The exposure of the negative depends on the luminance of the objects in the photographed scene. The absolute level of the luminance is compensated by choosing an appropriate combination of film speed and lens aperture. The relative luminance of the objects determines the tonal composition of the image.
The luminance of surfaces is measured in candela per square meter or foot lambert. Both are linear scales, that means a surface emitting or reflecting twice as much light as another has double the luminance. In the scene of Figure 1.1, the pathway (3) is approximately 16 times brighter than the deep shadows in front of the house (1). Some of the sun reflections on the roof (5) are again 32 times brighter than the pathway. The dynamic range, the ratio of the brightest to the darkest part in this scene, is approx 500:1.
Photographers and cinematographers prefer to measure exposure in “stops”. That is a logarithmic scale, in which a surface emitting or reflecting twice as much light as another is “one stop higher”. In other words, the pathway in Figure 1.1 is 4 stops higher than the shadows and some of the highlights are 5 stops above the pathway. The dynamic range of the scene is 9 stops.
Another scale for exposure, used in densitometry, is relative log exposure (log E). A change of one stop equals 0.3 log E. Table 2.1 gives a comparison of the different scales.
You do not need to learn those scales; important is to know the relation between stops, log exposure, and linear exposure.
Table 2.1. Exposure scales.
| Absolute | Relative | ||||||
|---|---|---|---|---|---|---|---|
| EV (100/21) | cd/m2 | fl | Stop | Log Exposure | Zone | Ratio | Ratio (%) |
| 1 | 0.28 | 0.082 | -10 | -3 | 1/1024 | 0.10% | |
| 2 | 0.56 | 0.16 | -9 | -2.7 | 1/512 | 0.20% | |
| 3 | 1.1 | 0.33 | -8 | -2.4 | 1/256 | 0.39% | |
| 4 | 2.2 | 0.65 | -7 | -2.1 | 1/128 | 0.78% | |
| 5 | 4.5 | 1.3 | -6 | -1.8 | 1/64 | 1.56% | |
| 6 | 9 | 2.6 | -5 | -1.5 | 0 | 1/32 | 3.13% |
| 7 | 18 | 5.2 | -4 | -1.2 | I | 1/16 | 6.25% |
| 8 | 36 | 10 | -3 | -0.9 | II | 1/8 | 12.50% |
| 9 | 72 | 21 | -2 | -0.6 | III | 1/4 | 25% |
| 10 | 143 | 42 | -1 | -0.3 | IV | 1/2 | 50% |
| 11 | 287 | 84 | 0 | 0 | V | 1 | 100% |
| 12 | 573 | 167 | 1 | 0.3 | VI | 2 | 200% |
| 13 | 1147 | 335 | 2 | 0.6 | VII | 4 | 400% |
| 14 | 2294 | 670 | 3 | 0.9 | VIII | 8 | 800% |
| 15 | 4588 | 1339 | 4 | 1.2 | IX | 16 | 1600% |
| 16 | 9175 | 2678 | 5 | 1.5 | X | 32 | 3200% |
| 17 | 18350 | 5356 | 6 | 1.8 | 64 | 6400% | |
| 18 | 36700 | 10712 | 7 | 2.1 | 128 | 12800% | |
| 19 | 73400 | 21424 | 8 | 2.4 | 256 | 25600% | |
| 20 | 146801 | 42849 | 9 | 2.7 | 512 | 51200% | |
| 21 | 293601 | 85698 | 10 | 3 | 1024 | 102400% | |
Exposure value (EV) for a certain film speed and luminance (in fl or cd/m2) are absolute scales, while the other scales in Table 2.1 are relative. The reference point for the relative scales is arbitrarily set at EV 11. Any other value could be used as well.
If incident light with an intensity of one foot-candle (=10.76 lux) falls upon a perfect diffuse reflector then one foot-lambert (1 fl = 3.426 cd/m2) is reflected. If the reflectance of the object is 18% the luminance would be 0.18 foot-lambert. This is a rare example of an imperial unit system being easier to use than metric units.
A transparent material like film absorbs some of the light passing through it. The ratio of the transmitted to the incident light is called transmission or transmittance. For example, the illumination level is 200 units, and a piece of film placed between the light source and the sensor reads at 100 units: the transmittance is 0.5. Transmittance decreases with the darkness of the film.
Opacity is the reciprocal value of transmittance. It increases with the darkness of the sample, so it is a more convenient way of expressing blackness than transmittance, but its numerical value can range from 1 to 10,000.
Therefore, density (the common logarithm of opacity) is often preferred to transmittance or opacity. Like opacity, density increases as the film darkens. Density has the additional advantage that it accords with our perceptual judgments of how dark a sample is. In making a visual judgment, you would tend to describe a density of 1.0 as being about twice as dark as a density of 0.5. In this document density is written as “log D”.
With color negative film the density of each of the three dye layers has to be measured. This is done with a so-called “Status M” densitometer. Status M is an ISO (International Standards Organisation) standard specifying the spectral ranges of the visible light used to measure the three layers. Measuring “above base” means to subtract the density of the unexposed film. More information about Status M is given in the appendix.
Current color negative materials can capture a dynamic range of 9 stops (approx 500:1 in linear scale) or more. Have a look at Figure 1.1 again, where markers show five parts with specific tonal values.
-
Deep black. This part of the scene is so dark that there is almost no exposure of the negative; no details are visible.
-
2% black is the lowest value with some visible details. It is 3 stops below midgray.
-
18% gray is regarded as the average reflection in a scene.
-
90% white is 2.5 stops above midgray.
-
Highlights are 2 stops above the white point.
Figure 2.2 illustrates how the negative reproduces the tonal range of the scene as film densities. Such a graph is called the characteristic curve of the film. Note the relation between the log exposure and the resulting density is linear over a wide range. The “toe” is the slow increase of density at the bottom of the curve. The maximum density of the highlights sits around 1.6 log D above base. If there were even brighter highlights in the scene we would see a roll off at the end of the density curve, which is called “shoulder”.
The slope of the straight part of the curve is known as the “gamma” of the film. The gamma of a typical motion picture color negative film is 0.6.
Table 2.2. Scene luminance, log exposure and negative densities
| Stops | Label | Zone | Log Exposure | Scene Brightness | Density Above Base |
|---|---|---|---|---|---|
| -4 2/3 | D-Min [1] | -1.40 | 1% | 0.00 | |
| -4 1/3 | -1.30 | 1% | 0.01 | ||
| -4 | I | -1.20 | 1% | 0.02 | |
| -3 2/3 | -1.10 | 1% | 0.05 | ||
| -3 1/3 | -1.00 | 2% | 0.11 | ||
| -3 | 2% Gray [2] | II | -0.90 | 2% | 0.17 |
| -2 2/3 | -0.80 | 3% | 0.23 | ||
| -2 1/3 | -0.70 | 4% | 0.30 | ||
| -2 | III | -0.60 | 5% | 0.36 | |
| -1 2/3 | -0.50 | 6% | 0.43 | ||
| -1 1/3 | -0.40 | 7% | 0.49 | ||
| -1 | IV | -0.30 | 9% | 0.56 | |
| -2/3 | -0.20 | 11% | 0.62 | ||
| -1/3 | -0.10 | 14% | 0.69 | ||
| 0 | 18% Gray [3] | V | 0.00 | 18% | 0.75 |
| 1/3 | 0.10 | 23% | 0.81 | ||
| 2/3 | 0.20 | 29% | 0.87 | ||
| 1 | VI | 0.30 | 36% | 0.93 | |
| 1 1/3 | 0.40 | 45% | 1.00 | ||
| 1 2/3 | 0.50 | 57% | 1.06 | ||
| 2 | VII | 0.60 | 72% | 1.12 | |
| 2 1/3 | 90% White [4] | 0.70 | 91% | 1.18 | |
| 2 2/3 | 0.80 | 114% | 1.24 | ||
| 3 | VIII | 0.90 | 144% | 1.30 | |
| 3 1/3 | 1.00 | 181% | 1.36 | ||
| 3 2/3 | 1.10 | 229% | 1.43 | ||
| 4 | IX | 1.20 | 288% | 1.49 | |
| 4 1/3 | 1.30 | 363% | 1.55 | ||
| 4 2/3 | D-Max [5] | 1.40 | 457% | 1.61 |
The numbers in the column titled “Label“ refer to the markers in Figure 1.1. Enlarged portions of the marked areas are displayed in Figure 3.7.
Figure 2.3. Grain structure of intermediate film (left) and of camera negative film (right).
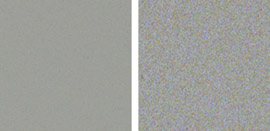
Both images are enlarged portions of scans done with the ARRISCAN and represent a film area of approx. 0.1 mm2. The camera film has a speed of 100 ASA. This type of camera negative film (Kodak 5248) is sometimes used in CRT film recorders.
Figure 2.4. Density histogram of an unexposed film
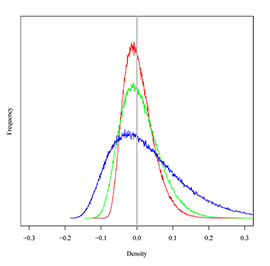
The actual density of the unexposed 500 ASA camera negative film ranges from –0.2 log D below and 0.2 log D above the average base density. Without an offset of 0.2 log D in the internegative the grain distribution would be truncated to the left of the zero line.
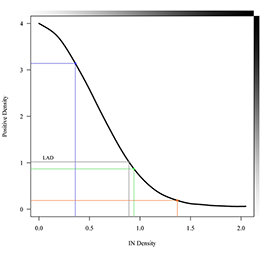
Figure 2.5. The IP/IN process

The numbers on the vertical axis in the graph are relative densities above base. The numbers beside the bars are absolute density values. In red for example, the OCN LAD value of 0.8 is printed to an IP LAD value of 1.15. This leaves enough room to accommodate the density range above and below the LAD (hatched in different angles) in the IP. The IP LAD is finally copied to an IN LAD of 1.00. The density range in the IN is the same as in the OCN, though the densities above base are shifted by 0.2 log D.
For protection against loss and damage the original camera negative (OCN) is copied to an intermediate film producing an interpositive (IP). This positive is printed again on the same material resulting in an internegative (IN). A large-scale cinema release needs several IN’s to create the prints.
The cross section through an intermediate film looks similar to the structure of negative film (see Figure 2.1). Intermediate films are less sensitive than negative films and therefore have a much finer grain as one can see in Figure 2.3. The fine grain is desired because the duplication process should not introduce additional grain to the image. The density of intermediate films (both IP and IN) is measured with Status M.
Intermediate film is designed to have a characteristic curve that is linear over a range of 2.0 log exposure, so it can reproduce the density range of camera negative films; the gamma is 1.0. Since camera negative always shows grain, even in the unexposed areas (see Figure 2.4), the IN has to be heavier than the OCN. Otherwise, one would lose some of the grain structure in the shadows. As shown in Figure 2.5 the density in the IN is shifted by approximately 0.2 log D.
The printing process is monitored with the Laboratory Aim Density (LAD) method introduced by Kodak. The LAD is a patch with standardized density in the negative. This patch is printed to specified aim densities when making internegatives, interpositives or prints.
The laboratory controls print density and color balance by increasing or decreasing the intensity of each primary color of light in steps called printer points. Since the development of the Bell & Howell Model C printer most manufacturers have standardized on a range of 50 light points in 0.025 log E increments. Some laboratories, however, use other exposure increments.
Figure 2.6. Cross section of color print film before and after processing.
The order of the dye forming layers in print film is different from negative film
Figure 2.7. Characteristic curve of print film.
The characteristic curve of motion picture print film is steeper and more S-shaped than the curve of negative film, the gamma is around 3.0.
Figure 2.8. IN to positive printing curve.
Note that the exposure of the print film decreases with the density of the negative. That is why the orientation of the curve is reversed compared with Figure 2.7.
Figure 2.9. Motion picture print through curve.
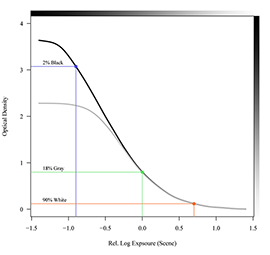
The scale of the vertical axis is the common logarithm of the relative screen luminance, which is called visual density.
The black line is the optimum print through curve, while the gray line shows the influence of 0.5% flare on the projected image.
Note that the horizontal axis represents the relative log exposure of the camera negative film that was used to photograph the scene.
In Figure 2.6 one sees the order of the dye forming layers in print film is different from negative film. The first one is green-sensitive, followed by the red-sensitive and blue-sensitive layer.
The density of print film is measured with a different spectral curve, named “Status A”, which is another ISO standard for densitometry.
The characteristic curve of print film is steeper and more S-shaped than the one of negative film; compare Figure 2.7 with Figure 2.2. The density range of print film is much higher, it is almost 4.0 for standard release print material. As a result the midscale gamma is around 3.
Like the IN/IP process the print process is controlled by the LAD method. The aim density for the LAD patch in the print is around 1.0.
Printing an internegative onto print film results in a relation between negative and positive densities that is illustrated in Figure 2.8. The normal placement of the LAD and of the 90% white, 18% gray, and 2% black tonal values is shown as well.
When a color negative or an IN is printed onto print film and projected, the resulting print-through curve, the relation between scene and screen luminance, is shown in Figure 2.9.
The gamma of the print-through curve has a midscale value of 1.8[1]. Also, one can see a shadow and highlight compression in Figure 2.9. There are three reasons that the grayscale of the motion picture system is not one-to-one with the original scene.
-
Reduced contrast. Motion picture print film has a density range of 4.0 log D. From this one could expect to have a luminance ratio of 104:1 or 10000:1 in the projected image, which would exceed the recorded scene contrast. But the actual screen contrast is reduced by stray projector light and from light that first reflects of the projection screen to surfaces in the room and than reflects back to the screen. Both effects are summarized as viewing flare, which is 0.5% to 1% of the maximum screen luminance for good projection rooms. 0.5% seems to be a small number but Figure 2.9 shows how flare reduces the contrast in the projected image from 10000:1 (4 log D) to 200:1 (2.3 log D). Therefore, the motion picture system has to squeeze a scene contrast of 500:1 or more into a screen contrast of 200:1.
-
Low absolute luminance level. The absolute luminance level of a projected image (around 50 cd/m2) is low relative to that of most original scenes (several hundreds cd/m2). This will result in the image being perceived as having lower luminance contrast and less colorfulness. The high photographic gamma of the motion picture system can be, in part, explained as a compensation for these effects.
-
Lateral brightness adaptation. When a motion picture print film is projected in a darkened room, there are few other visual references. Images viewed in a dark surround appear to have less contrast than images viewed in a dim or light surround. This effect occurs because the dark surround causes dark areas of the image to appear lighter, while having little effect on the light areas.
Since the observer will adapt to the projected image itself, it is acceptable to reproduce a white at a density higher than the minimum density of the print film (look at the 90% level in Figure 2.9). This makes it possible to use some of the density range of the print film to reproduce information corresponding to luminance levels above white, like specular highlights. By comparison, reflection images, photographic paper prints for example, must reproduce whites at densities close to the minimum density because the typical viewing environment contains white objects that essentially control the brightness adaptation of the viewer. A reflection image with darker whites would look too dark.
-
Photographic negative film linearly records log scene luminance as density.
-
The print through curve of the motion picture system is not linear. It introduces a compression of the shadows and highlights and has a gamma of approx 1.8 in the midtones. There are several reasons for this transfer curve.
-
Reduction of the scene contrast to a lower screen contrast.
-
Decrease of the scene luminance level to a lower screen luminance.
-
Brightness adaptation of the observer in a dark surround.
-
-
Projected images can display highlight information that is not visible in reflection images.