Figure 2.9. Motion picture print through curve.
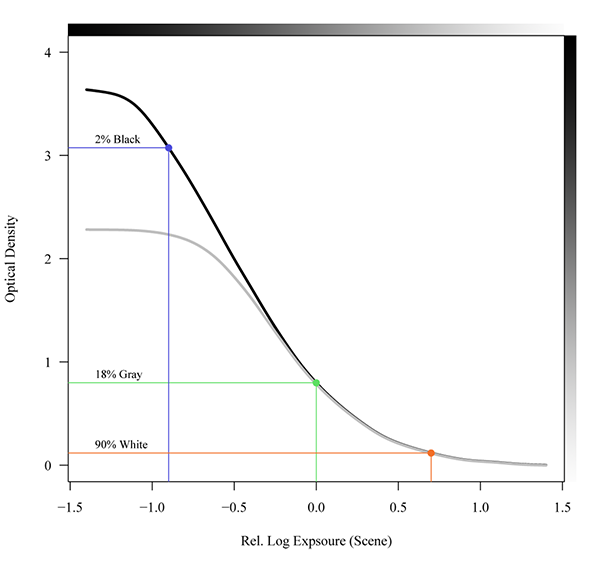
The scale of the vertical axis is the common logarithm of the relative screen luminance, which is called visual density.
The black line is the optimum print through curve, while the gray line shows the influence of 0.5% flare on the projected image.
Note that the horizontal axis represents the relative log exposure of the camera negative film that was used to photograph the scene.