Figure 5.3. Characteristic curve of DLP projector as logarithmic plot.
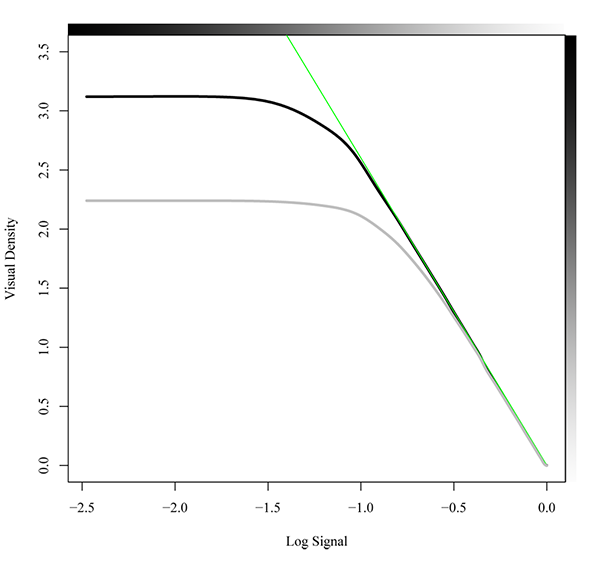
The characteristic curve of a DLP is similar to the curve of a CRT monitor. Again, the black line is the optimal transfer curve while the gray line shows the influence of 0.5% flare. The green line shows the “gamma” of the straight part of the curve.