ARRI COMPANION TO DI

Figure 5.2. Characteristic curve of CRT monitor as logarithmic plot.

Characteristic curve of CRT monitor as logarithmic plot.

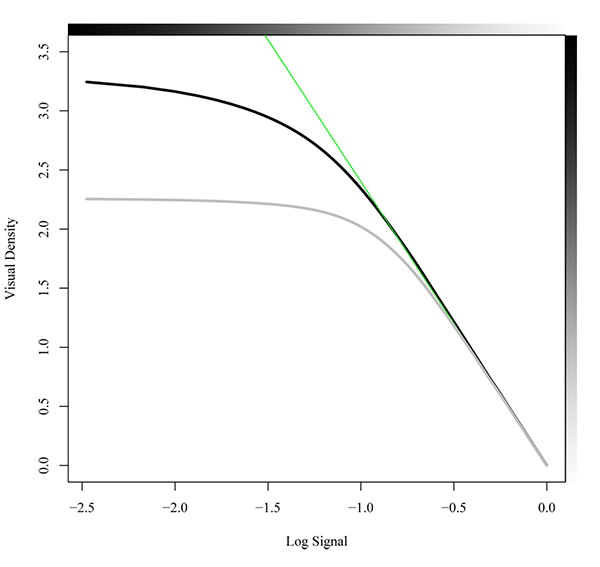
The black line is the optimal transfer curve while the gray line shows the influence of 0.5% flare. The green line is the “gamma curve”, which becomes a straight line in a log plot.

Related Figures
Characteristic curve of CRT monitor as linear plot.
Characteristic curve of CRT monitor as logarithmic plot.
Characteristic curve of DLP projector as logarithmic plot.