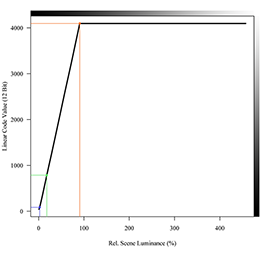
Figure 5.1. Characteristic curve of CRT monitor as linear plot.
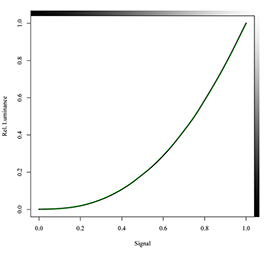
In a linear plot one can not see a difference between the interpolated measurements (black line) and the theoretical gamma curve (green line).
Figure 5.2. Characteristic curve of CRT monitor as logarithmic plot.
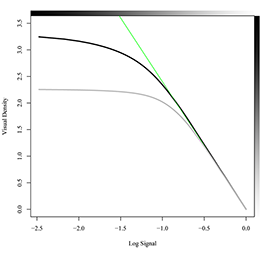
The black line is the optimal transfer curve while the gray line shows the influence of 0.5% flare. The green line is the “gamma curve”, which becomes a straight line in a log plot.
In the CRT (cathode-ray tube) of a computer or video monitor an electron beam moves back and forth across the back of the screen. Each time the beam makes a pass across the screen, it lights up phosphor dots (pixels) on the inside of the glass tube, thereby illuminating the active portions of the screen. By drawing many such lines from the top to the bottom of the screen, it creates an entire image. A color CRT uses three electron guns which activate red light-emitting, green light-emitting, and blue light-emitting phosphors.
The output of the electron gun is not linearly related to the monitor signal. The relation is a power law where the exponent is known as “gamma”, see Figure 5.1. The gamma value for monitors is typically around 2.4. Some mathematical background is explained at the end of this section.
The usual display of the transfer curve with linear units conceals some of the details in the lower values. Looking at the plot with log units in Figure 5.2, you see that the curve is bent at lower signal levels. The CRT can not produce an absolute black, even when the driver signal drops to zero some electrons are emitted from the gun.
The characteristic curve of the CRT is found by measuring the luminance of single gray patches with increasing intensity. From the logarithmic plot one could assume that the CRT can display an image with a contrast of 1000:1. As with film projectors we have to consider viewing flare, though. It is caused by stray light reflected from the monitor’s glass faceplate and by internal reflections in the tube. Again, the flare may be small in linear terms (0.5 to 1.0%), but the visual impact of the effect is much better presented in logarithmic scales, as in Figure 5.2.
To judge the performance of an image display device it is always preferable to look at a logarithmic plot of the characteristic curve.
It was stated earlier that gamma is the straight line of the characteristic curve of negative film. Now, gamma is described as an exponent. The reason for this difference is that the characteristic film curve is a log-log plot (density vs. log exposure), while the transfer curve of monitors is usually displayed with linear units (luminance vs. driver signal). A power equation with linear units like
luminance = signal ^ gamma
becomes a linear equation with log units
log(luminance) = log(signal) * gamma
Figure 5.3. Characteristic curve of DLP projector as logarithmic plot.
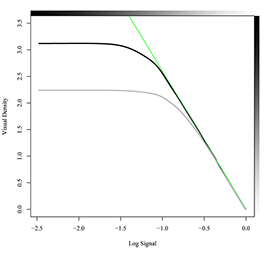
The characteristic curve of a DLP is similar to the curve of a CRT monitor. Again, the black line is the optimal transfer curve while the gray line shows the influence of 0.5% flare. The green line shows the “gamma” of the straight part of the curve.
DLP is the abbreviation for Digital Light Processing, a new technology developed by Texas Instruments used for projecting images onto a large screen for presentations. DLP uses tiny mirrors housed on a special microchip called a Digital Micromirror Device (DMD).
Digital projectors are quite adjustable in their characteristics. The Digital Cinema Initiative (DCI) recommends to run the projector with a gamma of 2.6. The characteristic curve of a DLP tuned to this recommendation is similar to the curve of a CRT monitor. Compare Figure 5.3 with Figure 5.2.
Figure 5.4. Transfer curve for print film contrast simulation on CRT monitor.
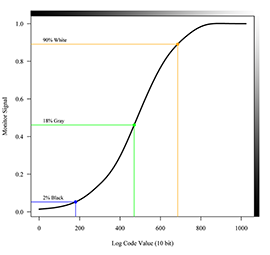
This transfer curve renders a DPX image on a CRT monitor that has the grayscale characteristic depicted in Figure 5.2 to match a projected print of the negative.
Figure 5.5. Linear luminance encoding clipped above reference white.
This is still the only display mode or, even worse, conversion offered by some image processing software for Cineon/DPX files.
Figure 5.6. Scene in linear luminance encoding clipped above reference white.

The image is gamma corrected for display on CRT monitor.
Figure 5.7. ITU-R BT.709 transfer curve.
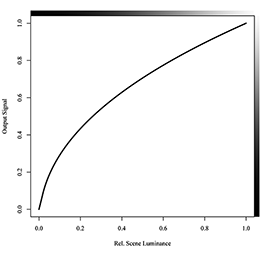
The overall shape is a compensation for the characteristic curve of a CRT monitor, but the ITU function is not simply a mathematical inverse of the monitor characteristic.
Figure 5.8. Broadcast system transfer curve.
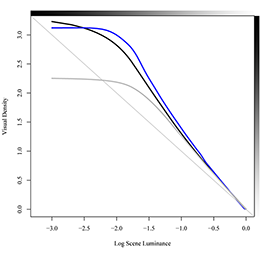
This is the “print-through curve” of the broadcast system. The black curve shows the relation between scene luminance and monitor luminance, the gray curve reflects the influence of 0.5% viewing flare. The thin straight line is the unity slope.
A digital projector has a higher gamma than a monitor because projected images in a dark surround need another characteristic than images viewed in a dim surround. The system transfer function resulting from using a DLP projector instead of a monitor is shown in the blue curve.
Since the characteristic curves of print film and monitor are known, one can calculate a transfer curve, which produces a good match between the former and the latter. The result is illustrated in Figure 5.4. Displaying Cineon/DPX scans from a negative with this curve brings out images with grayscale characteristics matched to a projected print from the same negative. More has to be done to achieve a good color match as well, this will be the topic of the next chapter.
Not surprisingly, the curve shows the same non-linear characteristics as the curve of print film displayed in Figure 2.7. Is this curve only an artifact of the motion picture system? Can we abandon this transfer function once Digital Cinema has replaced traditional print release?
A display of a photographed scene on a monitor or on a digital projector has to deal with the following conditions.
-
Because flare light generally is white, its addition will also reduce the saturation of colors.
-
The absolute luminance level of the display will be lower than in the original scene. As explained before this results in lower perceived luminance contrast and colorfulness.
-
Lateral brightness adaptation in a dark or dim surround will reduce the perceived contrast as well.
To compensate for the conditions 2 to 4, a higher midtone gamma must be used. But at the same time the viewing flare constrains the display contrast to a range which is typically lower than in the photographed scene.
-
Map the original scene contrast linearly into the display. If one wants to keep the specular highlights, the resulting image looks much too dark as was already seen in Figure 3.12.
-
Transfer the scene contrast with a higher gamma while clipping at the reference white point; the result is shown in Figure 5.6. The midscale brightness looks correct but compared with Figure 1.1 it has flat shadows and the specular highlights are missing.
-
Apply a shadow and highlight compression preserving some of the differences in the lower and upper end of the tonal scale. This is the S-shaped transfer function of the motion picture system.
It is a common misconception to think of the S-shaped transfer function of photographic systems as a result of chemical limitations. No matter if the scene was photographed on film or with a digital camera and regardless of the encoding the optimum reproduction characteristics are highly nonlinear.
The television broadcast system is not one-to-one with the original scene either. The recommendation ITU-R BT.709 specifies the encoding of luminance values with a power function where the gamma value is 0.45, see below. A video camera according to this standard outputs RGB values which are related to the scene luminance as shown in Figure 5.7. This is a compensation for the characteristic curve of a CRT monitor, but the ITU function is not simply a mathematical inverse of the monitor characteristic. The resulting transfer function, when the camera signal is viewed on a broadcast monitor, looks like Figure 5.8 . It has a non-linear shadow compression and the gamma value is greater than one. To some degree the higher gamma is a compensation for viewing flare. Although the gray curve, where a flare of 0.5% was assumed, still has a midscale slope of approx. 1.2.
The ITU function is derived from experience with broadcast video cameras that have been adjusted by skilled camera operators such that excellent quality video images are produced. This experience shows that a video image needs a higher-than-one gamma to be judged as a good reproduction of the scene. This can be explained by the same effects as before: lower luminance and lateral brightness adaptation. Since video images are normally viewed in a dim surround, the system gamma is lower than in motion picture film, which is viewed in a dark surround. Also, the standard video system is not designed to capture highlights above the reference white point.
-
CRT monitors have a non-linear characteristic, known as a gamma curve. A simple power function, however, does not give an accurate description of the monitor performance at low luminance values.
-
DLP projectors are made to have a characteristic curve similar to CRT monitors; the gamma value is greater to compensate for the viewing conditions in a dark projection room.
-
For an optimal reproduction of a photographed scene having a large contrast on a digital display an S-shaped transfer function is needed.
-
The television broadcast system is not one-to-one with the original scene.